On this page
Before you start
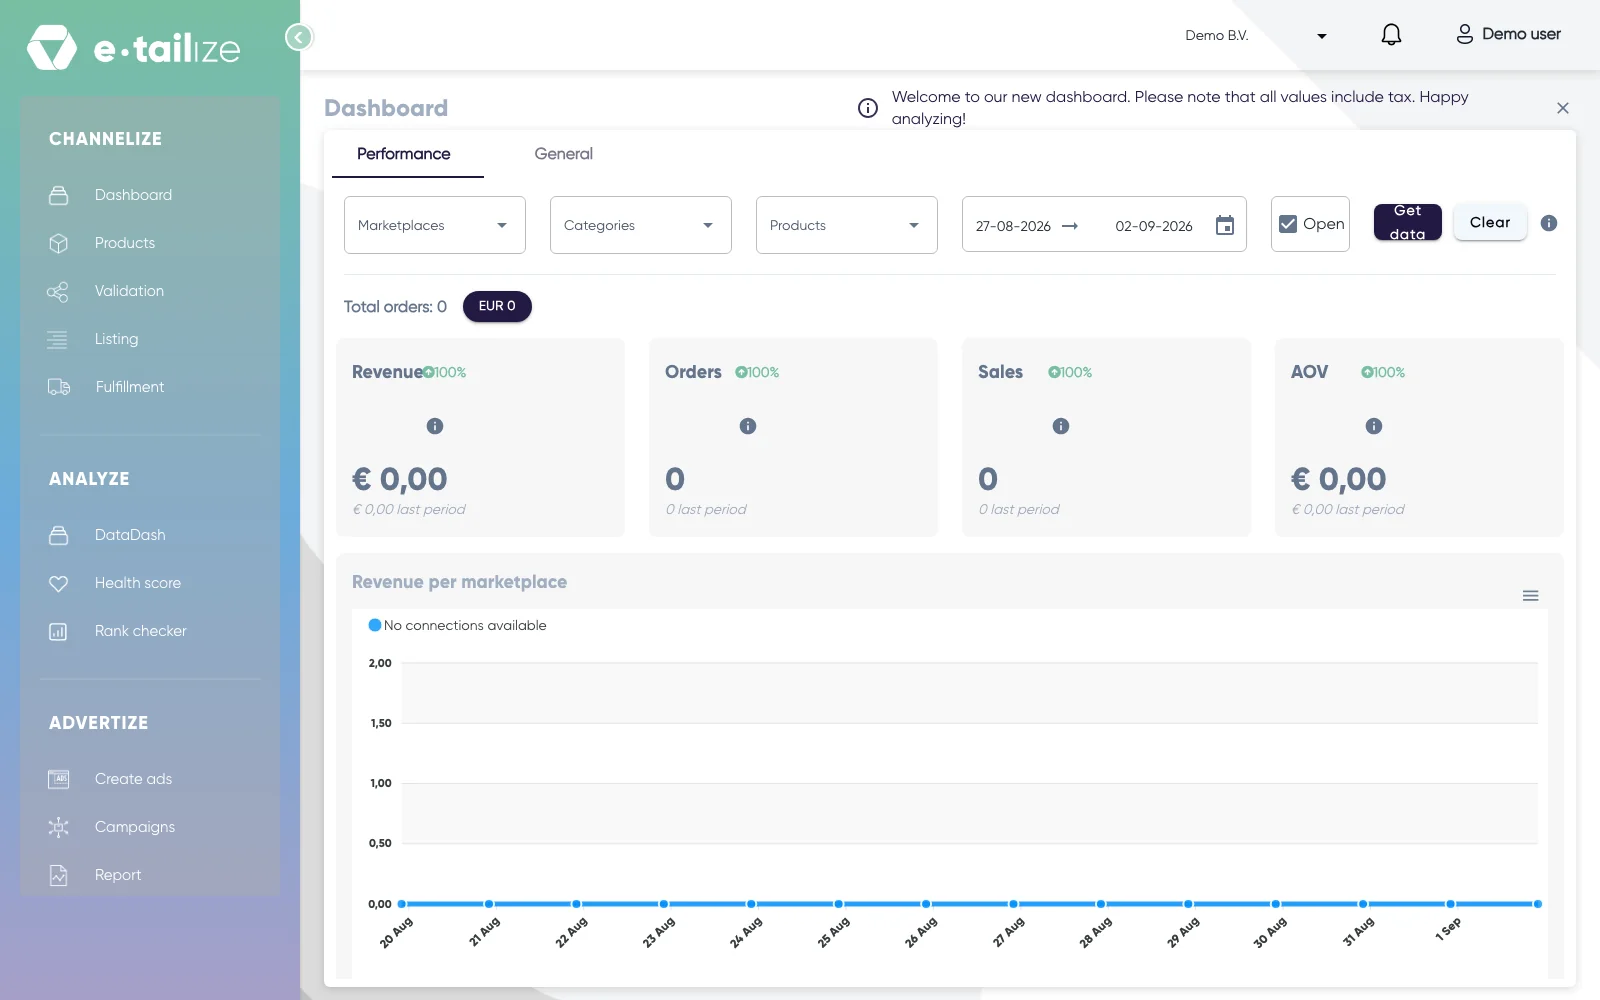
The dashboard belongs to the project you opened, so the numbers, the chart and the connections on it are that project's. The banner next to the heading "Dashboard" says the other thing worth knowing: all values include tax.
The page has two tabs. "Performance" opens by default and holds your sales figures. "General" holds your imports, your connections and your pinned products.
Steps
The filter bar
"Marketplaces", "Categories" and "Products" each open a panel with a search box, a "Select all" option and a checkbox per item. Next to them sit two date fields with a calendar, set to the last 7 days by default, and the checkbox "Open", which includes open orders and is ticked by default.
Nothing changes while you tick: "Get data" applies your selection and refreshes the page, "Clear" resets it. A range longer than 30 days is refused, so view a long history one period at a time.
The four tiles
"Revenue" is the total order amount, "Orders" the number of orders, "Sales" the number of products sold, and "AOV" the average value of an order. Each tile compares your period with the one before it and shows that older value underneath as "last period".
Under the filter bar you see one button per currency you have orders in, each with its own count. Click one and the whole tab switches to that currency. Amounts of two currencies are never added up into one number.
The chart and the tables
"Revenue per marketplace" draws one line per marketplace, and its menu offers "Download SVG", "Download PNG" and "Download CSV". Below it, the sections "Marketplaces", "Category" and "Product" each show a share of revenue and a "More information" table. Those tables cannot be exported.
The General tab
"Products import" and "Products export" hold the logos of the webshop systems you import from and export to. "Existing connections" shows a card per marketplace connection, and "Pinned products" the products you keep an eye on. You pin one on the products page: click the pin in the "Pin" column and the toast "Product pinned successfully" appears. On the dashboard, each pinned row has an "Edit" link and an "Unpin" button.
Common problems
Zeros everywhere, a chart without a line and no tables at all usually mean your selection has no orders. Walk the causes in order. Check that you opened the right project, because the dashboard only shows that project's data. Check that the project has a marketplace connection, because the chart legend reads "No connections available" when it has none. Then click "Clear" to drop your filters, because "Clear" also resets the date range to the last 7 days. Widen the range after that and click "Get data", because nothing refreshes until you do. Last, check that you are on the right currency button. If all of that checks out and the page stays empty, ask our support team.
A section can also be empty on its own: "No revenue" in the graphic and "No orders to display" in the table say the same thing for that one breakdown.
FAQ
Why do my numbers differ from yesterday?
The default range moves with the day, so yesterday's view covered other days. Open orders count as well while "Open" is ticked, and those still change. Compare with the same range and the same filters.
Why do I see less history than I expected?
The longer you are a customer and the more connections you add, the more history there is to show. The 30 day maximum per view applies on top of that.
Was this useful?